

Product build ยท Analytics software

Conversational BI for teams with no data team

Connect a spreadsheet or database and come back to a dashboard that already means something, then reshape it by asking in plain language.

Client
Analytics software sold to consulting and services firms
Engagement
End-to-end product build, architecture through delivery
Our role
Product architecture, backend, data platform, AI layer, front end
Status
Live with customers
Numbered roadmap items, each with its own specification

58

Database roles, so least privilege is enforced, not assumed

3

Command to bring the entire stack up locally

1

Model calls routed through one traced gateway

100%

In brief

Small and mid-sized firms keep their operating data in spreadsheets and a few application databases, and traditional BI tools go unused because nobody in the building can model data or write queries. Involabs built a multi-tenant platform that profiles an uploaded file or database connection, streams data through Kafka, creates the materialized views and views each dashboard needs, and delivers real-time analytics. Users create and update dashboards by asking questions in plain language, with workspace isolation and row-level security built in.

Architecture

How it works

  1. Connect

    File or database

    • Upload or connection
    • One workspace per tenant
  2. Stream

    Kafka ingestion

    • Real-time data streams
    • Materialized views and views per dashboard
  3. Profile

    Deterministic profiling

    • Every column profiled
    • Business domain classified
    • Safe cleaning only
  4. Generate

    Dashboard specification

    • Defined once in Pydantic
    • Types generated for the UI
  5. Refine

    Ask and pin

    • Answer with the working shown
    • Pin to dashboard
    • Every change reversible

The situation

Small and mid-sized firms hold their operating data in spreadsheets and one or two application databases. Traditional BI tools assume someone in the building can model data, write a query language and design a dashboard. Nobody in these firms can, so the tools go unused and decisions are made from a spreadsheet one person maintains.

What we built

A multi-tenant platform that ingests a file or a connection, profiles every column deterministically, classifies the business domain, cleans what it can safely clean and generates a dashboard specification. From there the user talks to it: ask a question, get an answer with the working shown, and pin the result to the dashboard.

Data streams through Kafka, and the platform creates the materialized views and views each dashboard needs in Postgres, so analytics stay current in real time. Users create or update dashboards by asking in plain language.

How it is engineered

  • One contract, two languages. The dashboard specification is defined once in Pydantic. TypeScript types are generated from it, and drift between the two fails the build rather than surfacing as a runtime bug.
  • Row-level security that binds. Three database roles: a migration superuser, a request-handling role that owns nothing and can bypass no policy, and a worker role with access to the job queue and nothing else.
  • Workspace isolation by construction. Every request resolves to one workspace the caller belongs to, or is refused before the endpoint runs. Storage is one DuckDB analytical database file per workspace behind a three-verb, read-only interface.
  • A queue that survives a crash. Postgres-backed, with row locking, leases and bounded retries. The worker is the same image as the API with a different command.
  • Streaming that resumes. A resumable server-sent event stream per workspace, with a plain request fallback returning identical rows.
  • One door for every model call. A model registry and a single LiteLLM gateway with structured output, retries, fallback and Langfuse tracing confirmed end to end.

Why it matters commercially

The isolation model is what makes the product sellable to more than one customer at a time. The specification contract is what lets a small team keep shipping without breaking the surface a paying customer already depends on.
Product

Screens

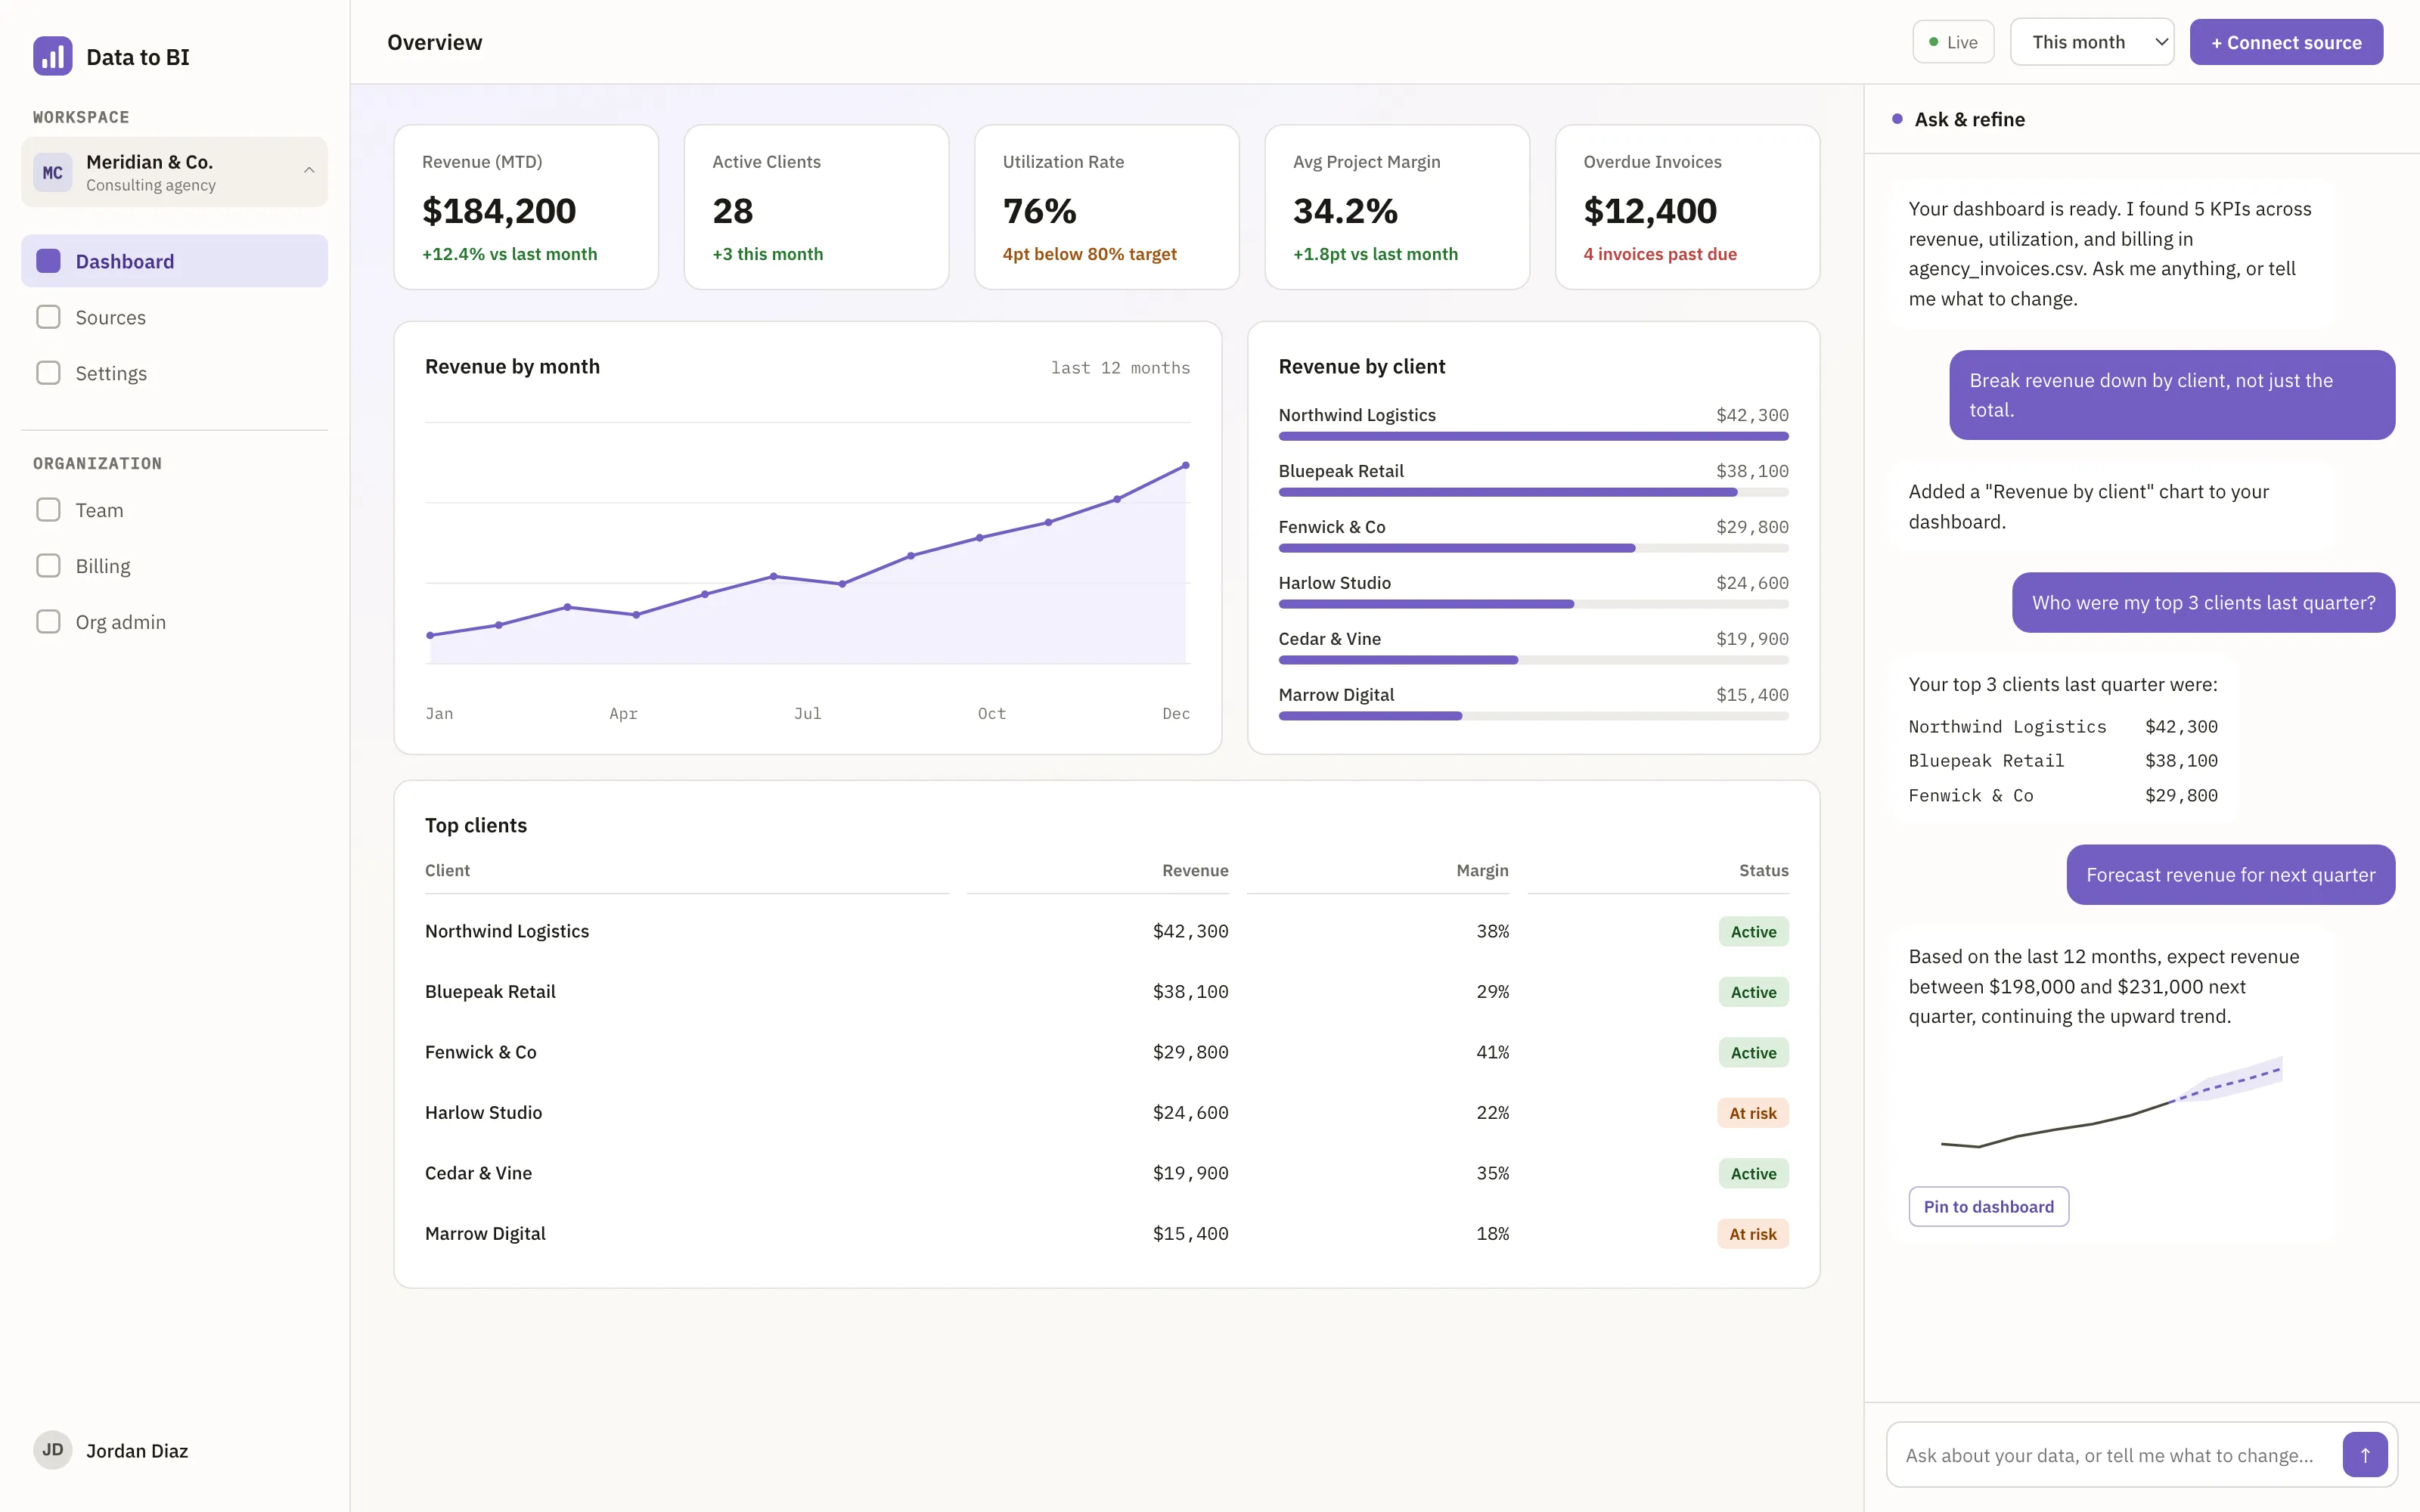
Generated dashboard with revenue, utilization and client charts, and a chat panel where the user refines the dashboard in plain language
A generated dashboard with the refinement panel open. Every change made in conversation is reversible. Sample data.
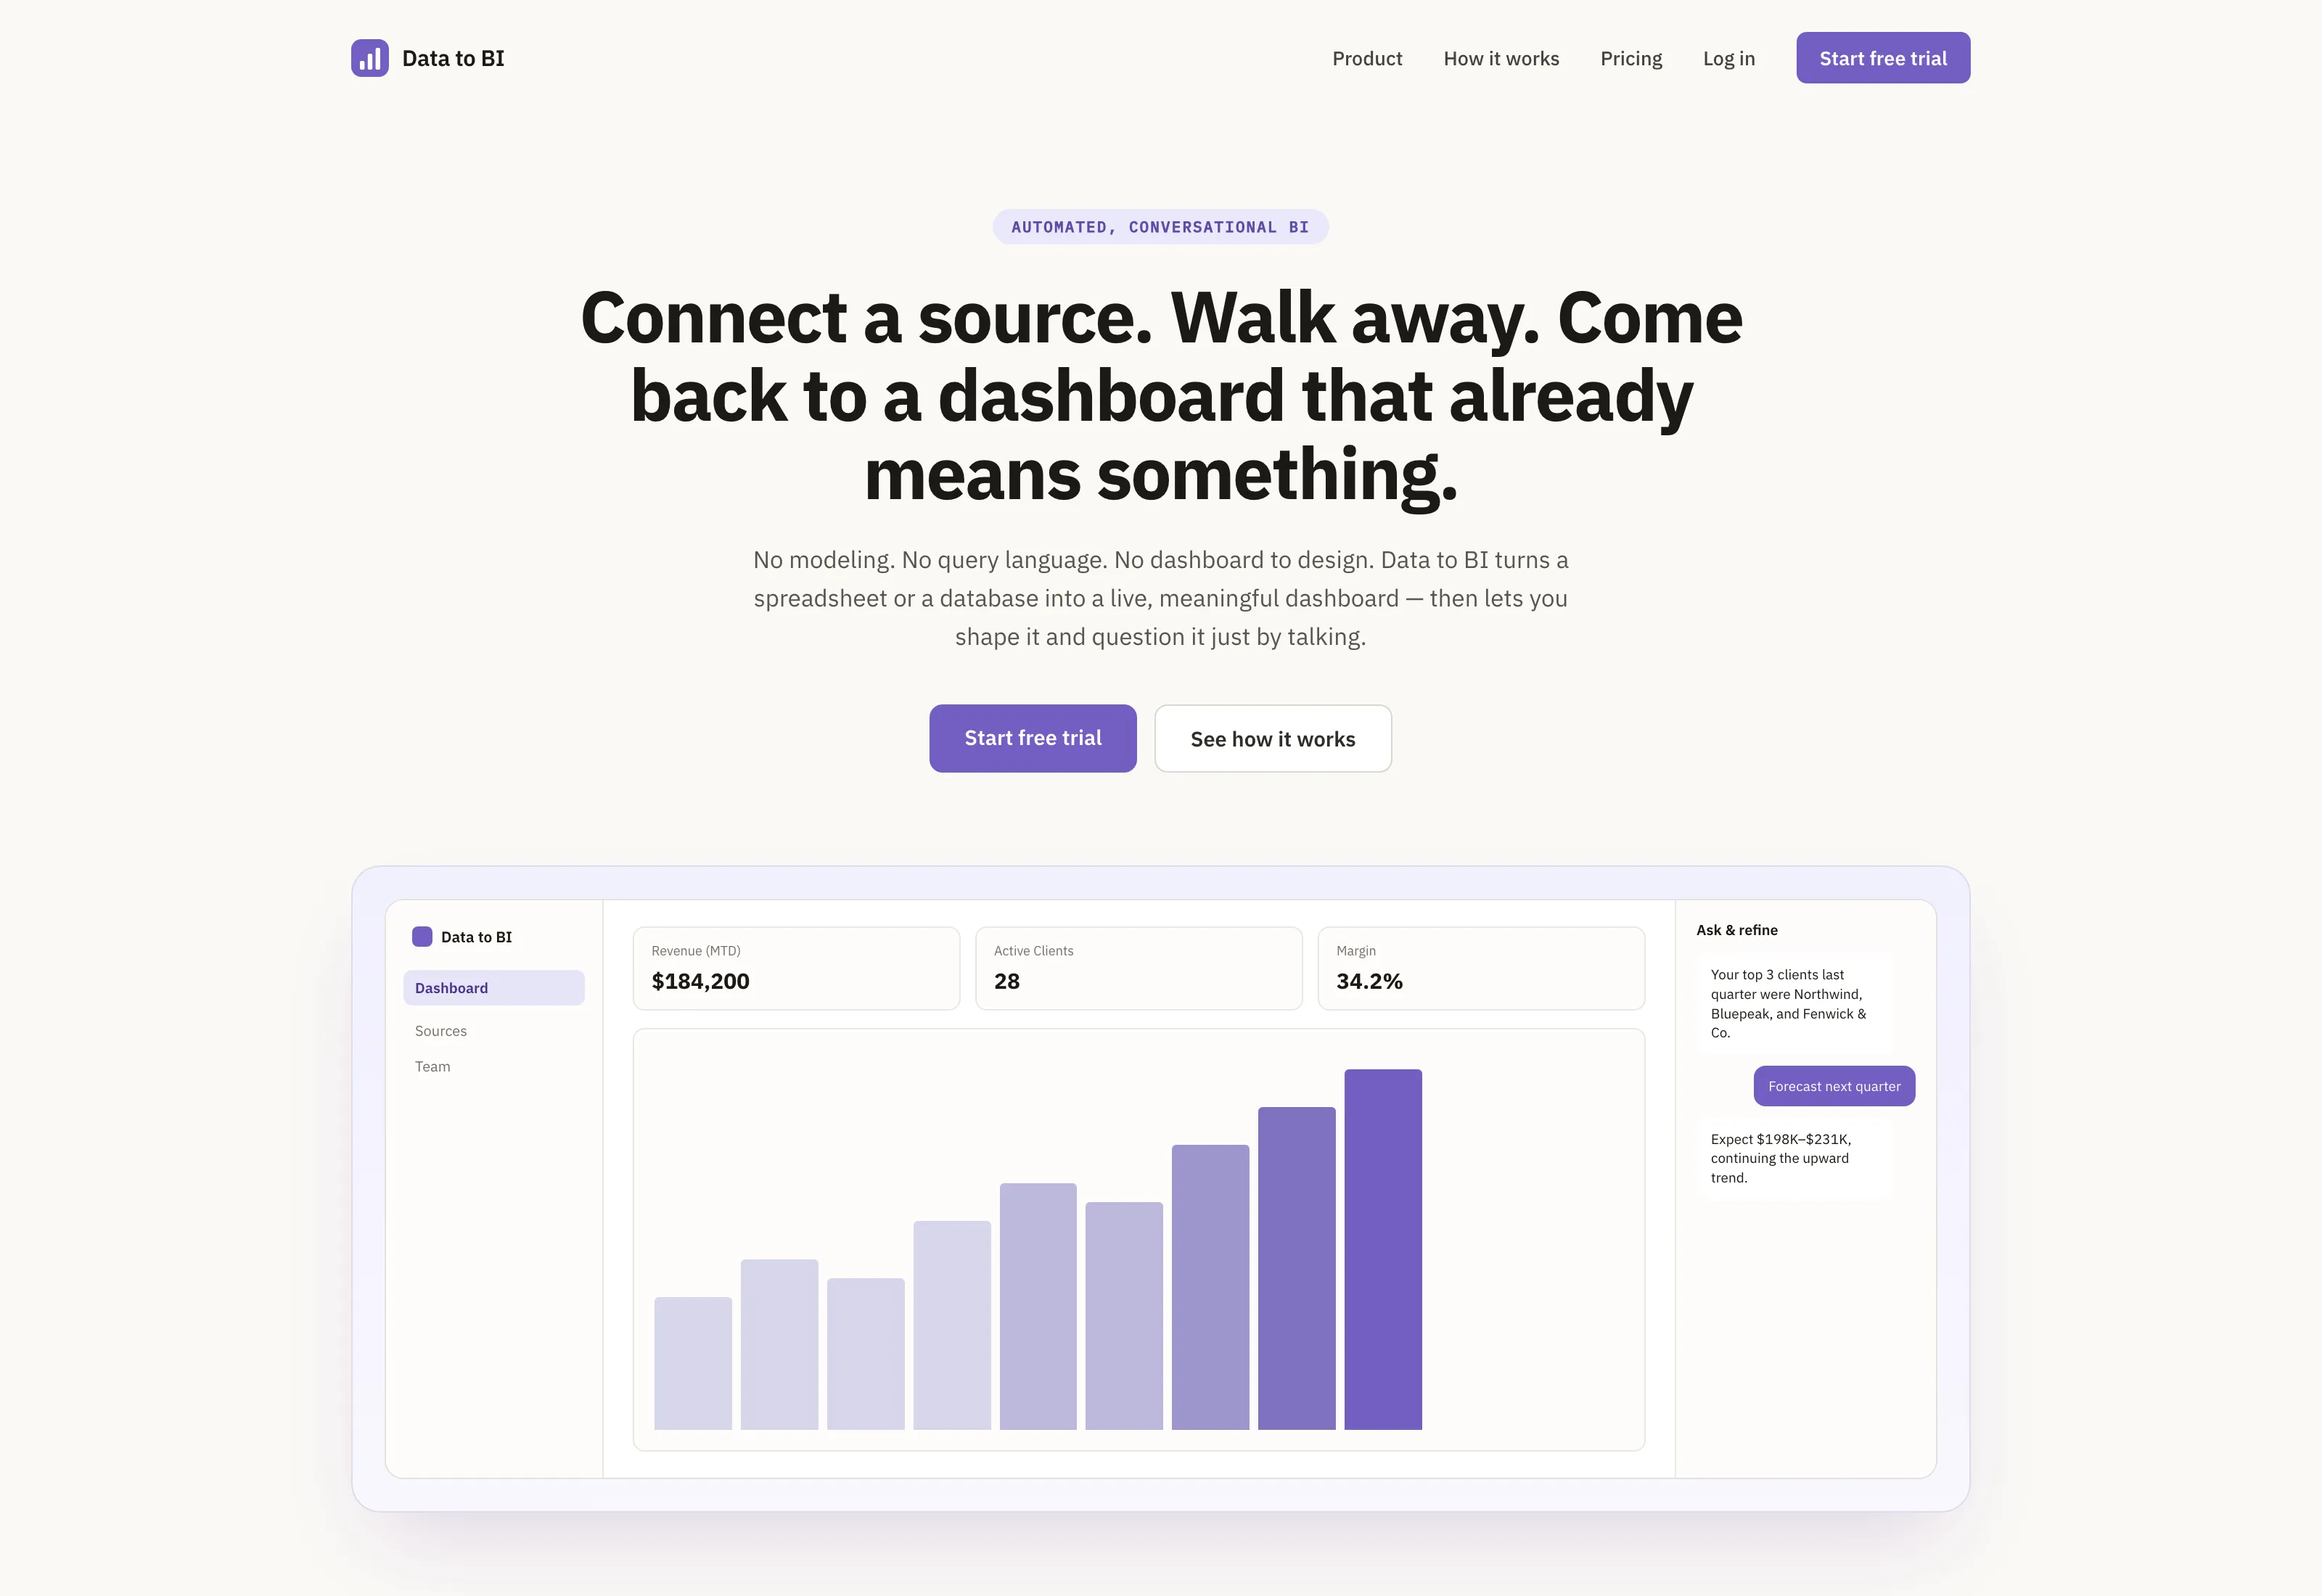
Product landing screen explaining connect a source, get a dashboard, refine by chat
The promise is deliberately narrow: no modeling, no query language, no dashboard to design.

Have a similar problem?

Send us the problem and the constraints. We will tell you what it would actually take, starting with a fixed-scope assessment.